 heala
healaMake Your Scale Tell the Truth With a 7 Day Centered Average

Make Your Scale Tell the Truth With a 7 Day Centered Average
Weight trend smoothing filters out the daily static of water, food, and sodium so you can see the direction your body is actually heading. The single rule worth adopting today: stop reacting to any one weigh-in and instead track a 7-day centred rolling average or an EMA tuned to your weigh-in habits. Weigh yourself each morning after using the toilet, plot the smoothed line, and you’ll spot fewer false alarms and a clearer weekly trend.
TL;DR:
- Using a 7-day centered average or an exponential moving average with a half-life of 3 to 4 days provides the best balance between responsiveness and noise reduction for daily weigh-ins.
- Weighing first thing in the morning before food or drink and after using the toilet minimizes common daily water and food-related fluctuations.
- Smoothing methods preserve slow, meaningful fat-loss trends while filtering out rapid, misleading water, food, or hormonal swings.
- Longer smoothing windows delay the detection of genuine weight changes, so adjust your half-life or window based on weighing frequency and your goals.
- Consistency in weighing time and conditions outweighs frequency, as well-calibrated inputs are crucial for accurate trend analysis.
Table of Contents
- Why your weigh-ins bounce and what the smoothing must preserve
- Moving averages and EMA: the two engines behind every trend line
- Choosing your smoothing strength: windows, half-life, and the lag trade-off
- Building it yourself: formulas and pseudocode you can copy
- How Heala applies this in practice
- Checklist, pitfalls, and how to troubleshoot a strange reading
- Where to check the maths and tools yourself
- What the maths actually tells us that most advice misses
- Try Heala’s weight trend line and stop guessing at the scale
- Sources
- FAQ
Why your weigh-ins bounce and what the smoothing must preserve
A single number on the scale is mostly noise wearing a trend’s clothes. Body weight can shift significantly across a normal day due to factors like water retention, undigested food still in transit, glycogen stores fluctuating with carbohydrate intake, and hormonal changes such as those during the menstrual cycle. None of that reflects fat loss or gain. Real fat change, by contrast, moves at a much slower pace, typically accumulating or reducing gradually over weeks during a sensible deficit.
That gap between noise and signal is the entire reason smoothing exists. A good smoothing method needs to preserve the slow-moving trend while discarding the fast, meaningless wobble.
Timing narrows that wobble before any maths gets involved. Weighing first thing in the morning, immediately after waking and using the toilet, before food or drink removes several noise sources in one move, because your body hasn’t yet absorbed food, retained overnight fluid shifts, or processed anything you ate the night before.
The main culprits behind day-to-day swings:
- Sodium and carbohydrate intake, which pull water into or out of tissue.
- Undigested food and fluid still sitting in your gut.
- Hormonal water retention, especially around the menstrual cycle.
- Scale placement, calibration drift, and even flooring type.
- Exercise-induced glycogen depletion or replenishment.
None of these erase the trend. They just bury it under noise that smoothing is built to remove.
Moving averages and EMA: the two engines behind every trend line
Two families of maths do almost all the work in weight trend tools, and understanding both means you’ll never be confused by an app’s settings screen again.
- Centred rolling average. Take the readings from a symmetric window around a given day, say three days before and three after, and average them. The formula is simple: average of weight on days (t−3) through (t+3). It’s the most accurate at showing what happened on a past date because it uses future data to cancel out noise, but it can’t tell you today’s trend since it needs days that haven’t happened yet.
- Trailing rolling average. Same idea, but the window only looks backward, averaging the last 7 (or 14, or 21) days up to and including today. This is what most tracking apps default to because it works in real time, though it lags behind sudden real changes by roughly half the window length.
- Exponential moving average (EMA). Instead of a flat window, EMA weights recent readings more heavily using a smoothing factor α: trend_today = α × weight_today + (1 − α) × trend_yesterday. A useful way to set α is via half-life: choose how many days it should take for an old reading’s influence to fall by half, then derive α from that.
Libra’s trend calculation adapts this further with a time-based power term, so the update becomes trend_new = trend_prev + power × (weight − trend_prev), where power scales with the actual elapsed time since your last entry rather than assuming daily readings. That single tweak is what stops a five-day gap from distorting your trend line.
For most people, EMA or a rolling average is plenty. Kalman filters and other state-space methods exist and can, in theory, model measurement uncertainty more precisely, but they’re overkill unless you’re building tracking software rather than using it.
Choosing your smoothing strength: windows, half-life, and the lag trade-off
More smoothing means a calmer line and fewer false alarms, but it also means the trend reacts more slowly to genuine change. Getting this balance right depends almost entirely on how often you weigh in.
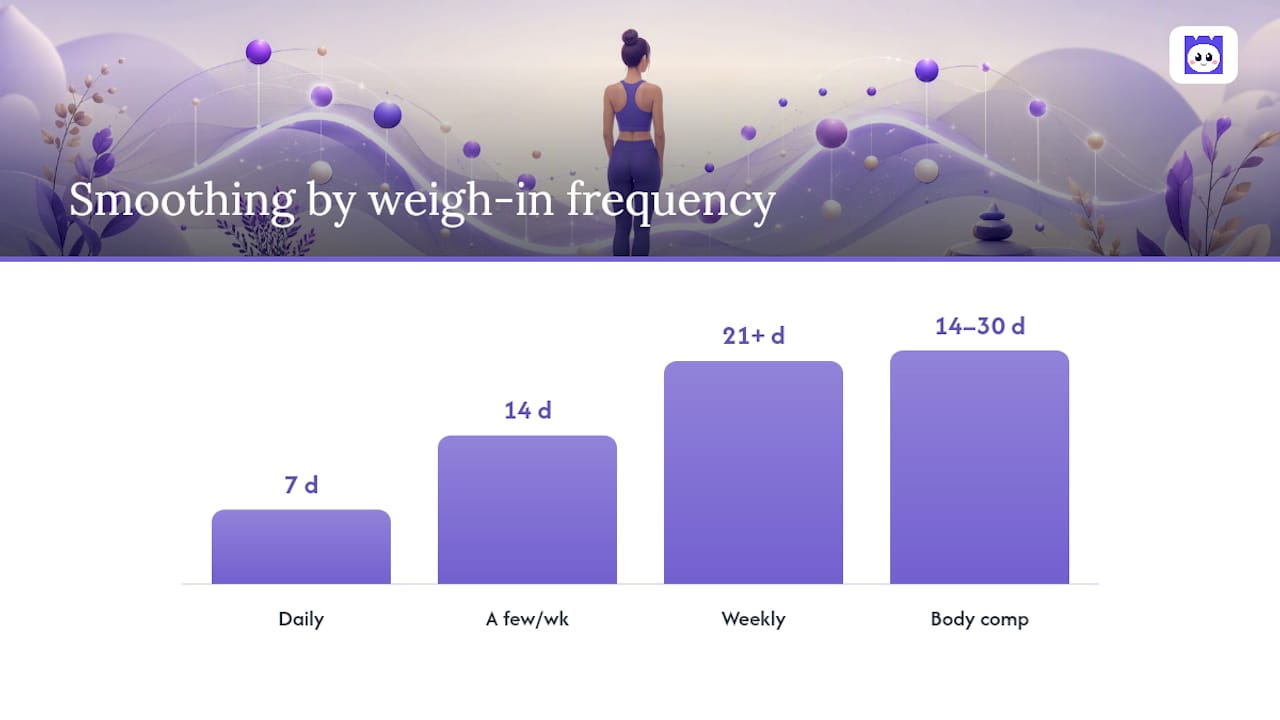
| Weigh-in frequency | Suggested window / half-life |
|---|---|
| Daily | 7-day centred average, or EMA half-life ≈ 3 to 4 days |
| A few times a week | 14-day window |
| Weekly | 21+ days |
The trade-off is unavoidable: a 7-day window smooths out water swings nicely but takes roughly 3 to 4 days to fully register a real 1 kilogram change. Stretch that to 21 days and the line barely twitches for the first week of a genuine shift. If your goal is spotting a plateau early, lean toward a shorter half-life. If you’re prone to over-reacting to noise, lean longer.
Body-composition numbers, fat mass and lean mass especially, deserve extra caution. These figures are noisier than total weight because they’re usually estimated rather than directly measured, so they benefit from windows of 14 to 30 days rather than the 7 typically used for weight alone. A tape measurement around the waist can sometimes tell you more in a shorter timeframe than a smoothed body-fat percentage.
Pro Tip: If you’re chasing a specific event, a wedding, a competition, a holiday, shorten your half-life in the final two weeks. You’ll trade some noise resistance for a trend line that actually reflects where you stand right now.
Building it yourself: formulas and pseudocode you can copy
You don’t need custom software to run any of this. A spreadsheet handles the first two methods without any scripting.
- Centred rolling average in a spreadsheet. For a 7-day window:
=AVERAGE(C4:C10)where the date in question sits in the middle cell, C7, and the range spans three days either side. - Trailing average.
=AVERAGE(C1:C7)where C7 is today and the range reaches back six days, updating one row at a time as new entries arrive. - Converting half-life to α. Use α = 1 − 0.5^(1/half_life). A 4-day half-life gives α ≈ 0.16, meaning each new reading contributes about 16% to the updated trend.
- Time-weighted EMA for irregular entries. When gaps between weigh-ins vary, replace the fixed α with one that accounts for elapsed time:
trend_new = trend_prev + (1 - EXP(-days_elapsed / half_life)) * (weight_today - trend_prev). This is the same mechanism Libra uses to stop a missed week from throwing the whole line off course.
A short pseudocode version for a script or app:
for each new reading (date, weight):
    dt = date - last_date
    power = 1 - exp(-dt / half_life)
    trend = trend + power * (weight - trend)
    confidence = min(1, days_since_last_gap / half_life)
    last_date = date
That confidence score matters more than it looks. When entries are sparse, flagging low-confidence points stops you from reading too much into a trend built from three data points spread across a month. When you chart it, plot the raw daily dots alongside the smoothed line and mark any gap longer than two or three days, so a sudden jump doesn’t get mistaken for a real shift when it was really just a data drought.
How Heala applies this in practice
Heala’s weight-tracking trend line runs a time-weighted smoothing model against your logged weight, alongside sleep and recovery data pulled from connected wearables, so a rough night or a heavy training block gets factored into how a weight bump gets interpreted rather than treated as an isolated red flag.
Inside the app, there can be a half-life slider to adjust the trend smoothing without needing a spreadsheet, plus a confidence indicator that shows when logging has gaps. Body-composition metrics often get heavier smoothing by default, reflecting how noisier those readings tend to be than total weight alone.
*[Author note: insert Kerem’s professional credentials related to health and fitness]
Checklist, pitfalls, and how to troubleshoot a strange reading
Before you trust any smoothed number, check the basics are consistent:
- Same scale, same spot, every time, ideally on hard flooring rather than carpet.
- Morning weigh-in, after the toilet, before food or drink.
- Minimal clothing, and note anything unusual: travel, illness, a heavy salt meal the night before.
- Log holidays and gaps explicitly rather than leaving blank days, since a good time-weighted model needs to know a gap happened, not just that data is missing.
When you see a sudden jump, ask whether it looks like water (fast onset, fast reversal within days) or tissue (slower, sustained across a week or more). A one-off spike in a smoothed line, despite the smoothing, usually means either a genuine sodium or hydration event or a measurement error worth double-checking with a second weigh-in.
Pro Tip: If a smoothed trend keeps jumping around even with a 14-day window, suspect inconsistent timing rather than a broken formula. Most “noisy trend” complaints trace back to weighing at different times of day, not a maths problem.
Where to check the maths and tools yourself
For the clinical reasoning behind weigh-in timing, Cleveland Clinic’s guidance is worth reading in full. If you want to see the exponential smoothing formula applied to real weigh-in data, Libra’s trend explanation walks through the power term in detail. For a working implementation you can inspect line by line, the Withings weight smoother project shows centred, trailing, and EMA options side by side.
What the maths actually tells us that most advice misses
Most weight-loss content treats “don’t obsess over the scale” as a discipline problem, something you fix with willpower or by weighing less often. That’s backwards. The daily number isn’t unreliable because you’re too sensitive to it. It’s unreliable because it’s mathematically dominated by noise that has nothing to do with fat loss. The fix isn’t avoidance, it’s better arithmetic.
The conventional advice to “weigh weekly instead of daily” also falls short. Weighing less often doesn’t average out noise, it just gives you fewer, noisier data points and a shakier trend. Daily weigh-ins fed through proper smoothing beat weekly weigh-ins almost every time, because the algorithm does the averaging that infrequent weighing tries to achieve through omission.
If you take one thing from this, prioritise consistency of timing over frequency of weighing. A half-life of 4 days or a 7-day window can only do its job if the inputs feeding it were captured under similar conditions each time. Get that right first. The formula you choose afterwards matters far less than most people assume.
— Kerem
Try Heala’s weight trend line and stop guessing at the scale
Heala turns your daily weigh-ins into a smoothed trend line automatically, pulling in sleep and recovery context from your connected wearable so a rough night doesn’t get mistaken for real weight gain.

Rather than building spreadsheet formulas from scratch, you can adjust the half-life slider directly in the app and watch the trend respond, with a confidence score that flags any stretch where your logging has gaps. It also applies heavier smoothing automatically to body-composition readings, so fat mass and lean mass numbers don’t whipsaw the way raw weight does. Head to the weight-tracking feature page to see the trend line in action and set a half-life that matches how often you actually weigh in.
Sources
- When is the best time to weigh yourself? — Cleveland Clinic
- What is a trend? — Libra
- marceauboul/withings-weight-smoother — GitHub
FAQ
Is it normal to have a 2 kg difference in a day?
Yes. Water retention, food volume, sodium intake, and glycogen stores can swing body weight by 1 to 2 kilograms within a single day, which is exactly the noise that smoothing is designed to filter out.
What is the new trend for weight loss?
Rather than a new diet trend, the shift among data-curious trackers is methodological: using EMA or rolling-average smoothing on daily weigh-ins instead of reacting to single readings or weighing only once a week.
What does “weight trend” mean?
A weight trend is a smoothed version of your raw weigh-in data, typically a rolling average or an exponentially weighted average, that shows the underlying direction of change with daily noise removed.
Which is true weight, morning or night?
Morning weight, taken after waking and using the toilet and before eating or drinking, is the most consistent and comparable reading, which is why it’s the standard baseline for trend tracking.
Recommended
Heala opens 1 October 2026
Free forever — Pro is optional.
Photo food logging, adaptive training, a morning recovery score and a 3D body twin, in one app.